2.1 Basics of Data Wrangling
Data wrangling, or data munging, is the process of “wrangling” data from one format to another.
Let us imagine that you are interested in the heights of every student when they enter school for the first time at Primary 1. You spend time recording the heights and gender of each student. One very obvious format to store the data is to record your results in a three-column table, with name, gender, and height (in centimeters) being the three columns.
| Name | Gender | Height |
|---|---|---|
| Angela | Female | 116 |
| Brian | Male | 110 |
| Cathy | Female | 121 |
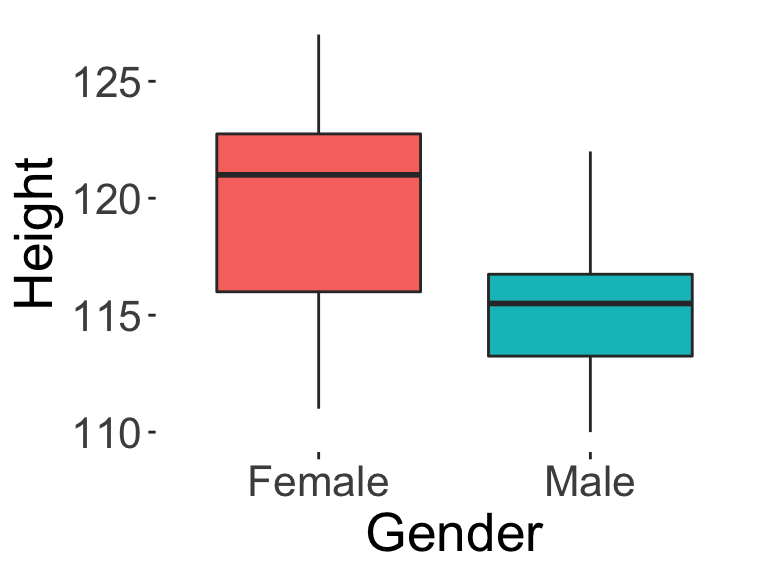
This is called wide-form data, where each observation is a single row, and each variable is in one column. This is a very common way of representing data, and is very useful for plotting variables. For example, when we have data in this format, we can easily call a function to represent the heights of Male vs. Female students using a boxplot, like below (see Data Visualization chapter for more on the boxplot and other visualizations).
Now, imagine that the following two years you get a chance to repeat the study with the same set of students. You collect their heights again at Primary 2, and at Primary 3. You decide to add two new columns, as follows:
| Name | Gender | Height_Pri1 | Height_Pri2 | Height_Pri3 |
|---|---|---|---|---|
| Angela | Female | 116 | 120 | 127 |
| Brian | Male | 110 | 116 | 123 |
| Cathy | Female | 121 | 125 | 131 |
This is still wide-form data, as each student’s data is still only in one row, and you have merely added two new variables as new columns.
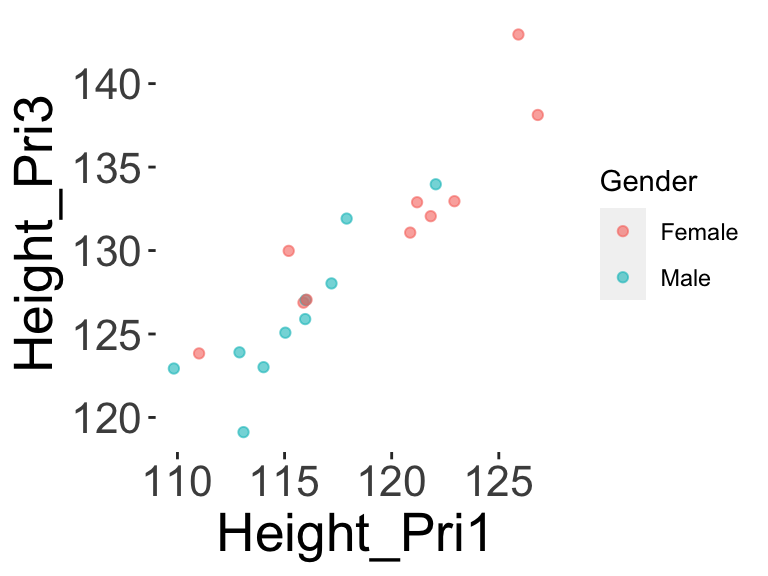
With this wide-form data, you could still do things like calculate the correlation between Height_Pri1 and Height_Pri2 using cor(df_wide$Height_Pri1, df_wide$Height_Pri2), or plot a scatterplot between their heights in Primary 1 and Primary 3, like so:
But now if you wanted to do something like look at the change of height over time, this representation may not be the easiest to do that type of analysis. Ideally we would want a case where each row had Primary School Level and Height, perhaps like:
| Name | Gender | School_Level | Height |
|---|---|---|---|
| Angela | Female | 1 | 116 |
| Angela | Female | 2 | 120 |
| Angela | Female | 3 | 127 |
| Brian | Male | 1 | 110 |
| Brian | Male | 2 | 116 |
| Brian | Male | 3 | 123 |
This is called long-form data, where each response is in one row. This also means that each student, because they were measured three times, would appear in three rows. If you notice above, the student Angela, appears three times.
A more general definition of long-form is one where each row contains a key-value pair. The value is the actual value of the variable (e.g., the value of “Height” in centimeters), while the key gives you the variables that are associated with that value (e.g. the “School Level” that the height was measured at).
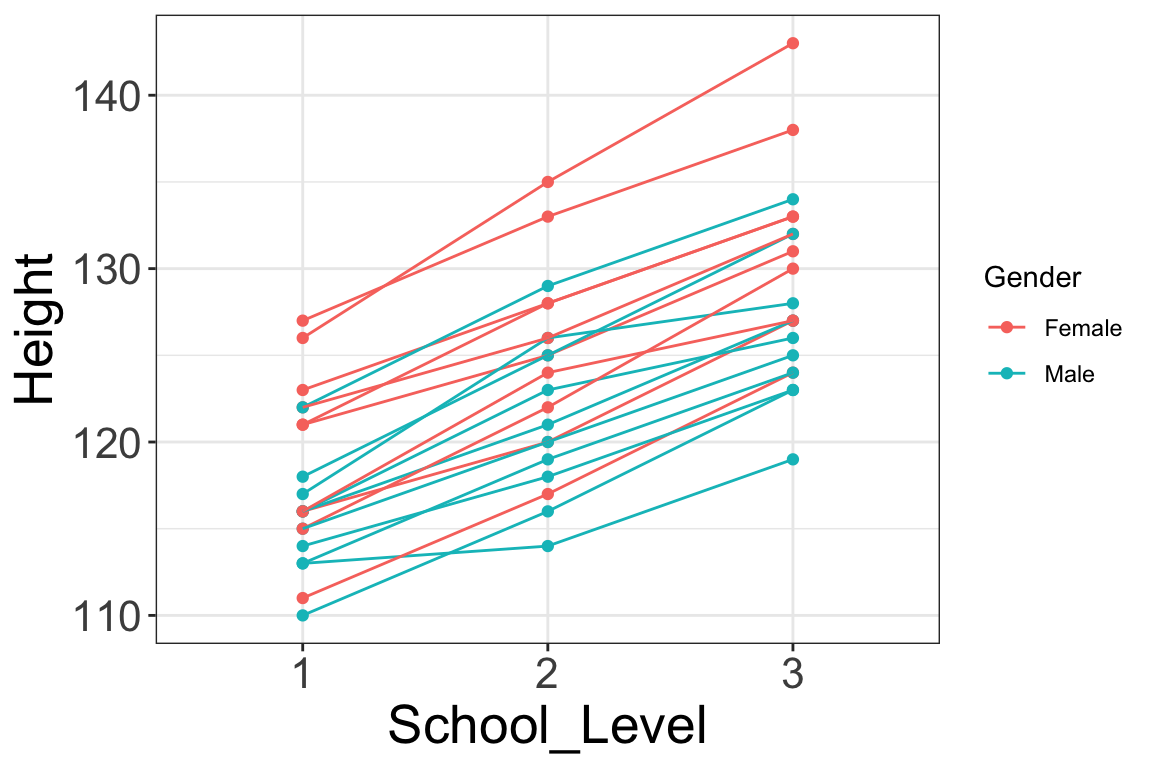
This data representation makes it easier to do other kinds of modelling, for example to model how Height increases over time with School Level. It also allows easier plotting such as the one below, whereby each student’s height trajectory is plotted (as separate lines) against time on the horizontal axis. (Note that this is an example of longitudinal or repeated measures data, which requires advanced multilevel modelling to properly model.)
In the next section we’ll learn a little bit about the functions needed to move between wide and long-form data.